In this article, I just share a small snippet to visualize a small simple kalman filter visualization code I came up with.
This is the visualization for a code quiz from Udacity -> "Intro to Self Driving Cars" -> Working with Matrices -> Lesson 2: Introduction to Kalman Filters -> Chapter 19: Quiz: Kalman filter code.
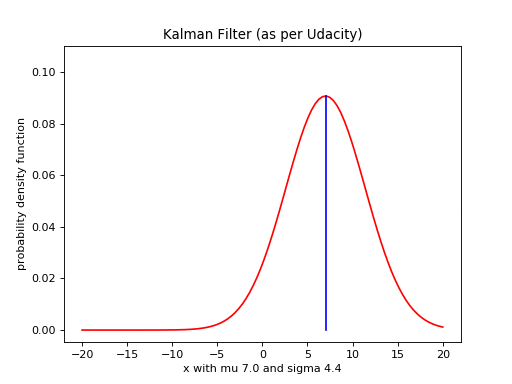
It is a very basic visualization snippet primarily to help create more like this for further topics. if save option is provided in argument, animation is saved as a gif else keeps playing in plot window.
Output:
Code:
import sys
import matplotlib.pyplot as plt
import numpy as np
from scipy.stats import norm
import matplotlib.animation as animation

fig = plt.figure()
ax1 = fig.add_subplot(1,1,1)

def plot_gaussian(x, mu, sigma):
    #y = gaussian_density(x,mu,sigma)
    y_pdf = norm(loc = mu, scale = sigma).pdf(x)
    ax1.clear()
    ax1.set_title('Kalman Filter (as per Udacity)')
    ax1.set_xlabel('x with mu {} and sigma {}'.format(round(mu,2), round(sigma,2)))
    ax1.set_ylabel('probability density function')
    ax1.plot(x,y_pdf,'r')
    ax1.set_ylim(ymax=0.11)
    ax1.plot([mu, mu],[0, max(y_pdf)],'b')

def update(mean1, var1, mean2, var2):
    new_mean = float(var2 * mean1 + var1 * mean2) / (var1 + var2)
    new_var = 1./(1./var1 + 1./var2)
    return [new_mean, new_var]

def predict(mean1, var1, mean2, var2):
    new_mean = mean1 + mean2
    new_var = var1 + var2
    return [new_mean, new_var]

x = np.linspace(-20, 20, 100)
measurements = [5., 6., 7., 9., 10.]
motion = [1., 1., 2., 1., 1.]
measurement_sig = 4.
motion_sig = 2.
mu = 0.
sig = 10000.

counter = 0
def animate(i):
    #print(i)
    global counter, mu, sig, x
    if (counter >= 4):
        mu = 0.
        sig = 10000.
        counter = 0
        plot_gaussian(x, mu, sig)
    else:
        (mu,sig) = update(mu, sig, measurements[counter], measurement_sig)
        (mu,sig) = predict(mu, sig, motion[counter], motion_sig)
        print(mu, sig)
        counter += 1
        plot_gaussian(x, mu, sig)

ani = animation.FuncAnimation(fig,animate,interval=1000)
plt.show()

if __name__ == "__main__":
    # FuncAnimation will call the 'update' function for each frame;
    ani = animation.FuncAnimation(fig,animate,frames=np.arange(0, 10),interval=1000)
    if len(sys.argv) > 1 and sys.argv[1] == 'save':
        ani.save('kalman_filters.gif', dpi=80, writer='imagemagick')
    else:
        # plt.show() will just loop the animation forever.
        plt.show()
Note: To save as gif, make sure imagemagick is installed in your system and matplotlibrc (config file) has the line "animation.convert_path" updated with imagemagick's convert.exe location specified. Below is one example. Do not remove the first character # (or in other words, do not uncomment)
#animation.convert_path: C:Program FilesImageMagick-6.9.2-Q16-HDRIconvert.exe